



An R package for univariate kernel density estimation
with parametric starts and asymmetric kernels.
kdensity is in maintenance mode: it gets bug fixes and the changes needed to stay on CRAN, but no new features.
kdensity implements univariate kernel density estimation with roughly
the same syntax as stats::density, adding three things:
parametric starts, asymmetric kernels, and
configurable bandwidth selection. Built-in parametric starts include
normal and gamma (see univariateML
for the full list), and the asymmetric kernels include
gcopula and Chen’s gamma and beta
kernels; you can also supply your own starts, kernels, and bandwidth
functions. The return value is itself a density function, ready for
numerical integration, differentiation, or point evaluation.
From inside R, use one of the following commands:
# For the CRAN release
install.packages("kdensity")
# For the development version from GitHub:
# install.packages("devtools")
devtools::install_github("JonasMoss/kdensity")Call the library function and use it just like
stats::density, but with optional additional arguments.
library("kdensity")
plot(kdensity(mtcars$mpg, start = "normal"))
A parametric start (Hjort and Glad, 1995) fits a parametric density first and uses kernel density estimation to correct it. When the true density is close to the start, this beats the ordinary kernel density estimator, and it often does well even when the start is some way off.
Asymmetric kernels avoid boundary bias for data on the unit
interval or the positive half-line. kdensity has Jones and Henderson’s
Gaussian copula kernel (gcopula), Chen’s beta kernels
(beta, beta_biased), and Chen’s gamma kernels
(gamma, gamma_biased). Starts and kernels can
be combined, as in the example below.
The function kdensity takes some data, a
kernel kernel and a parametric start start.
You can optionally specify the support parameter, which is
used to find the normalizing constant.
The following example uses the datasets::airquality data
set. The black curve is a gamma-kernel density estimate with a gamma
start, the red curve a fully parametric gamma density, and the blue
curve an ordinary density estimate. Notice the boundary
bias of the ordinary density estimator. The underlying
parameter estimates are always maximum likelihood.
library("kdensity")
kde <- kdensity(airquality$Wind, start = "gamma", kernel = "gamma")
plot(kde, main = "Wind speed (mph)")
lines(kde, plot_start = TRUE, col = "red")
lines(density(airquality$Wind, adjust = 2), col = "blue")
rug(airquality$Wind)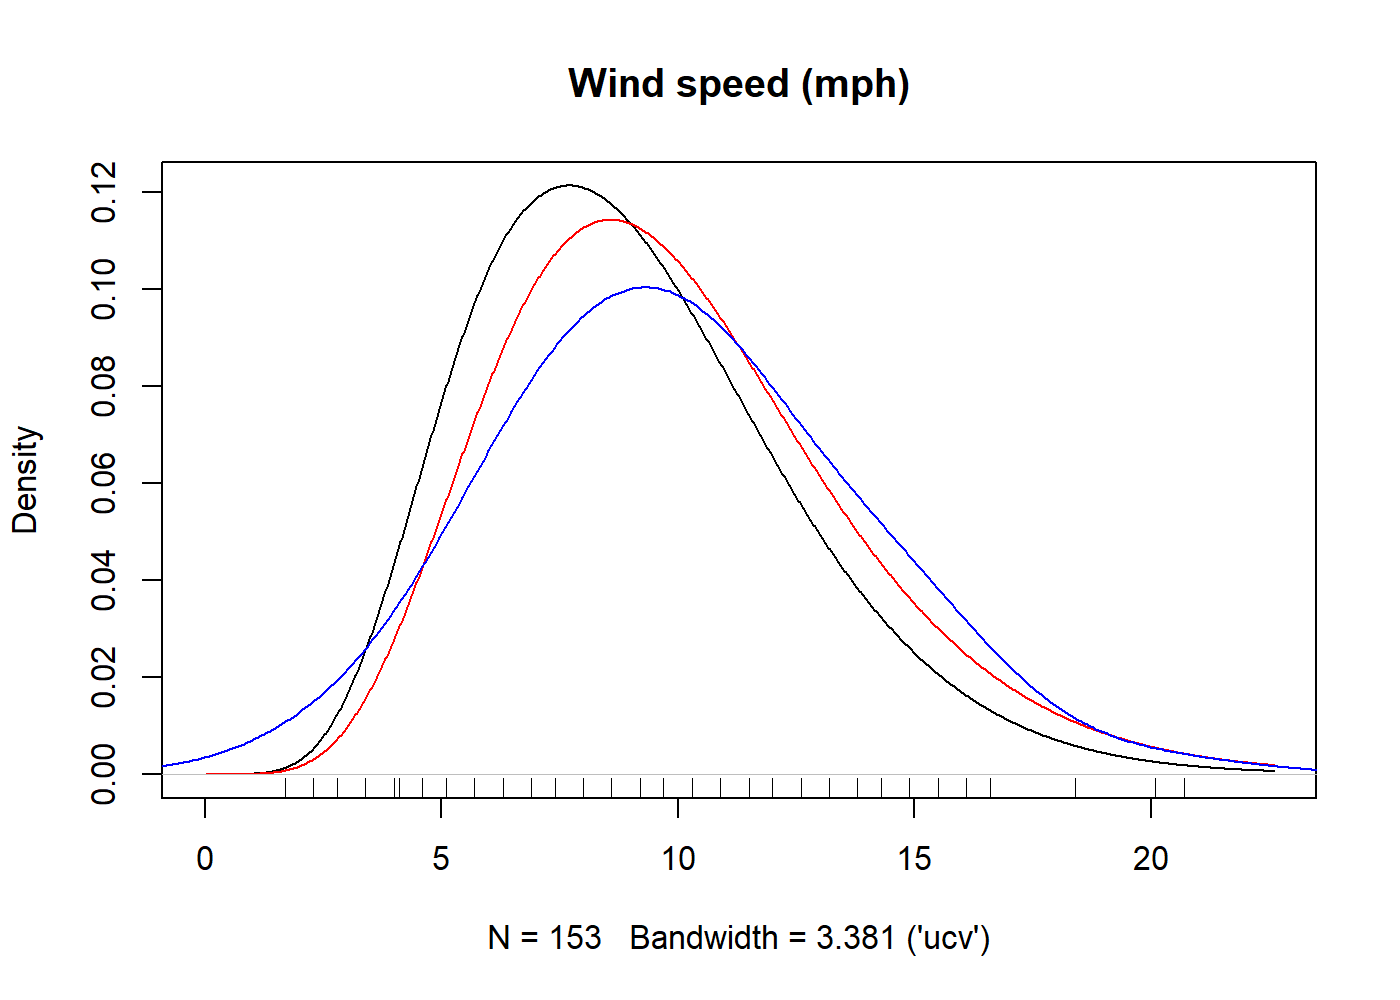
Since the return value of kdensity is a function,
kde is callable and can be used as any density function in
R (such as stats::dnorm). For example, you can
do:
kde(10)
#> [1] 0.1101274
integrate(kde, lower = 0, upper = 1) # The cumulative distribution up to 1.
#> 9.499222e-06 with absolute error < 1.5e-11
For large plotting grids, kdensity_grid() provides an
explicitly approximate binning-and-FFT backend for every built-in
symmetric kernel and the Gaussian-copula kernel. Calling
kde() remains exact.
You can access the parameter estimates by using coef.
You can also access the log likelihood (logLik), AIC and
BIC of the parametric start distribution.
coef(kde)
#> Maximum likelihood estimates for the Gamma model
#>  shape    rate
#> 7.1873  0.7218
logLik(kde)
#> 'log Lik.' -410.5129 (df=2)
AIC(kde)
#> [1] 825.0259