

wheatmap builds complex heatmap figures by composing
panels using plain-English placement directives: TopOf,
RightOf, Beneath, LeftOf, and
variants. Each panel is a named object; subsequent panels reference
earlier ones by name to anchor their position. The result is a single
+-chained expression that reads like a description of the
layout.
From CRAN:
install.packages("wheatmap")From GitHub (development version):
# install.packages("devtools")
devtools::install_github("zwdzwd/wheatmap")A wheatmap figure is built by chaining objects with +.
The first object anchors the coordinate system at full canvas extent.
Every subsequent object receives a placement generator —
RightOf("name"), Beneath("name"), etc. — that
resolves its position relative to a named predecessor at draw time.
Core object types:
| Constructor | Purpose |
|---|---|
WHeatmap() |
Heatmap body (continuous or discrete color mapping) |
WColorBarH() / WColorBarV() |
Horizontal / vertical annotation bar |
WLegendV() |
Vertical color legend keyed to a named heatmap |
WCustomize() |
Global figure settings (margins, background, etc.) |
Color mapping is controlled by CMPar(), which wraps
palettes from RColorBrewer, colorspace, and the built-in
jet/bwr maps.
Each object can be given a name= for cross-referencing.
If omitted, wheatmap assigns one automatically; ly() shows
all current names.
library(wheatmap)

WHeatmap(matrix(1:12, nrow=2), cmp=CMPar(brewer.name='Greens'), name='a') +
  WHeatmap(matrix(1:6,  nrow=1), Beneath(pad=0.05), cmp=CMPar(brewer.name='Set2'), name='b') +
  WHeatmap(matrix(c(1:30,30:1), nrow=5), Beneath(pad=0.05), name='c', cmp=CMPar(cmap='jet')) +
  WHeatmap(matrix(1:24, nrow=4), RightOf('c'), name='d', cmp=CMPar(brewer.name='Set1')) +
  WLegendV('c', LeftOf('c',  pad=0.01), yticklabel.side='l') +
  WLegendV('b', RightOf('b', width=0.1)) +
  WLegendV('a', RightOf('a')) +
  WHeatmap(matrix(1:100, nrow=10), RightOf('d'), cmp=CMPar(brewer.name='RdYlGn')) +
  WColorBarH(matrix(5:1), TopOf(), cmp=CMPar(colorspace.name='diverge_hcl')) +
  WColorBarH(matrix(50:1), TopOf(), cmp=CMPar(colorspace.name='terrain_hcl')) +
  WColorBarH(matrix(1:8),  TopOf(), cmp=CMPar(colorspace.name='sequential_hcl')) +
  WColorBarH(matrix(1:8),  TopOf(), cmp=CMPar(brewer.name='YlOrRd'))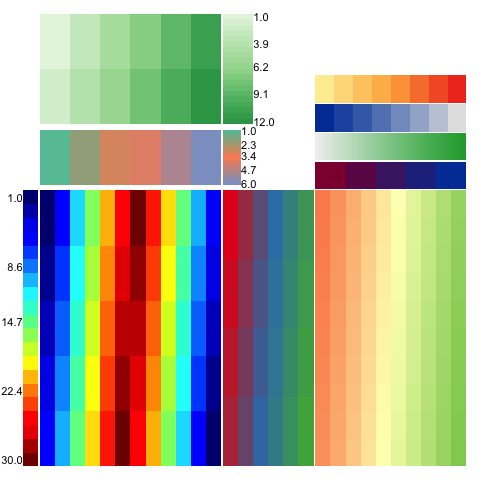
magrittr users can pipe with %>% and
add() instead of +:
library(magrittr)
WHeatmap(m, name='h1') %>% add(WColorBarV(row.data, LeftOf('h1'), name='c1'))print(g) wraps the figure in a gtable so that
outward-facing tick labels, colorbar labels, and legends are measured at
draw time and reserved as page margins rather than clipping at the
device edge. WCustomize(mar.*) values act as a minimum
floor; the measured extent wins when it is larger.
m <- matrix(rnorm(200), nrow=20)
rownames(m) <- sprintf("very_long_row_label_%02d", 1:20)
grp <- rep(c("groupA","groupB","groupC","groupD"), each=5)

g <- WHeatmap(m, name="main",
              yticklabels=TRUE, yticklabel.side='r', yticklabel.fontsize=7) +
     WColorBarH(grp, TopOf("main"), name="grp",
                label.use.data=TRUE, label.fontsize=8) +
     WCustomize()

pdf("output.pdf", width=5, height=5)
print(g)
dev.off()
Siblings placed via RightOf / LeftOf /
TopOf / Beneath are automatically shifted
outward by the measured label extent of their predecessor, so a legend
next to a labeled colorbar clears the labels rather than overlapping
them.
The internal grid.dendrogram() function is adapted from
the ComplexHeatmap package.